
What it does
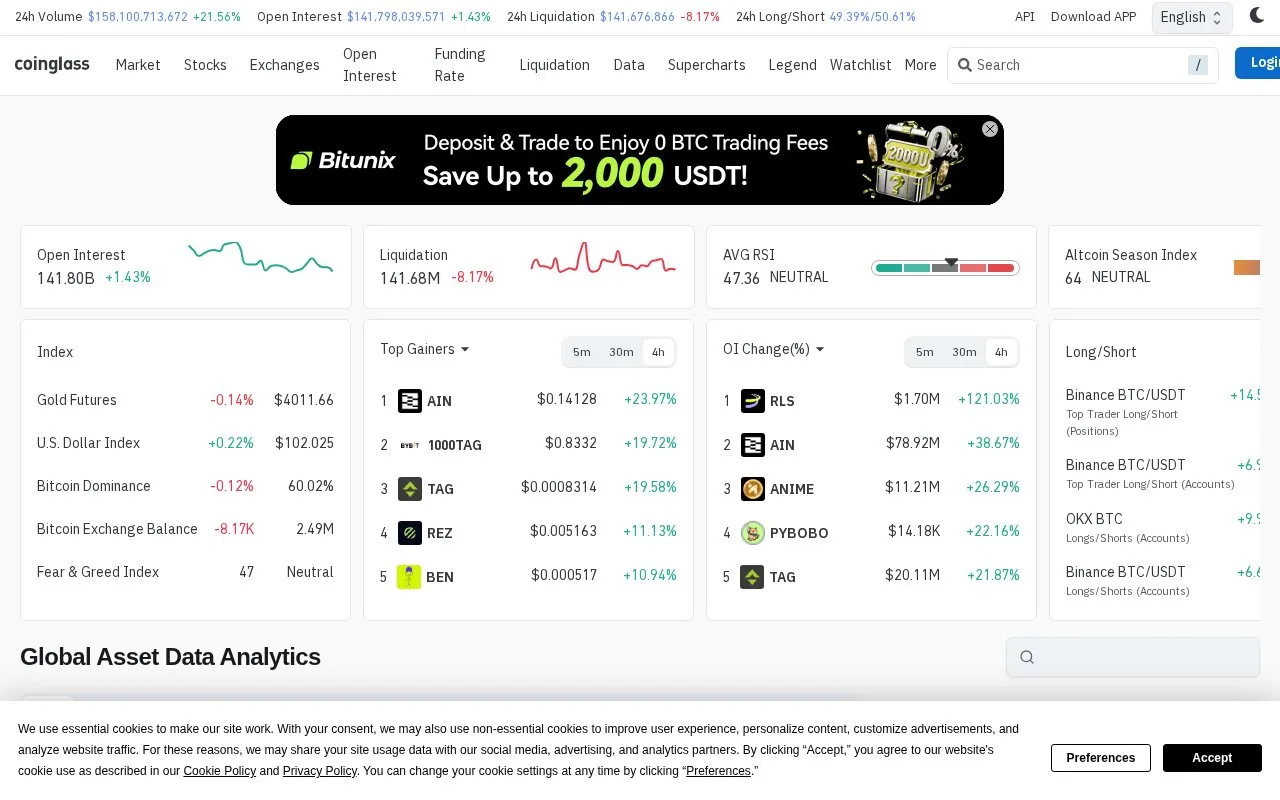
CoinGlass displays crypto derivatives indicators and exchange-traded fund flows in public market dashboards. Dashboard browsing does not require registration; its separate API plans charge for software access, with different historical depth and usage rights.
Open interest measures outstanding contracts, while liquidation totals describe positions forcibly closed. CoinGlass places those figures in separate panels alongside funding rates and volume. Match their observation windows before drawing a comparison: its dashboard offers short open-interest changes and one-hour, four-hour or daily liquidation totals.
For example, a daily liquidation total and a five-minute change in open interest describe different periods. Funding rates also need context from price and trading activity. CoinGlass’s own explanation cautions that funding alone is not a reliable market predictor, and these charts cannot ensure a profitable trade.
Taking the data into another tool
Create an account, log in and retrieve an API key for the software connection. The Exchange History Chart request takes a coin symbol and time range, plus a choice of dollar or coin units. Its response separates the timestamps, prices and exchange-specific open-interest series. Use those units consistently when comparing venues.
The API pricing page’s annual view lists Hobbyist at $348 per year, shown as $29 per month, and Startup at $948 per year, shown as $79 per month. Both are for personal use. Standard is $3,588 per year and includes commercial use. The equivalent monthly figures do not mean monthly billing.
History depends on both the plan and interval. Standard includes six days of one-minute history and thirty days of five-minute history; daily data is listed as all-time. Confirm the relevant dataset and interval before paying for a long historical study.
Strengths
- Fund-flow panels can switch between bitcoin and dollar values
- Exchange-history data keeps each venue’s series separate
- The dashboard places funding, volume and open interest side by side
Watch out for
- Lower API tiers restrict usage to personal purposes
- Fine-resolution historical access can be much shorter than daily history
Best for
- Readers comparing derivatives activity across time windows
- Analysts importing exchange-level open-interest history
Sources
- CoinGlass public market dashboard and observation windows (Oct 27, 2026)
- CoinGlass annual API pricing, commercial rights and historical depth (Oct 27, 2026)
- CoinGlass developer registration and API-key setup (Oct 27, 2026)
- CoinGlass exchange-history inputs, units and response data (Oct 27, 2026)
- CoinGlass funding-rate interpretation and predictive limits (Oct 27, 2026)