
What it does
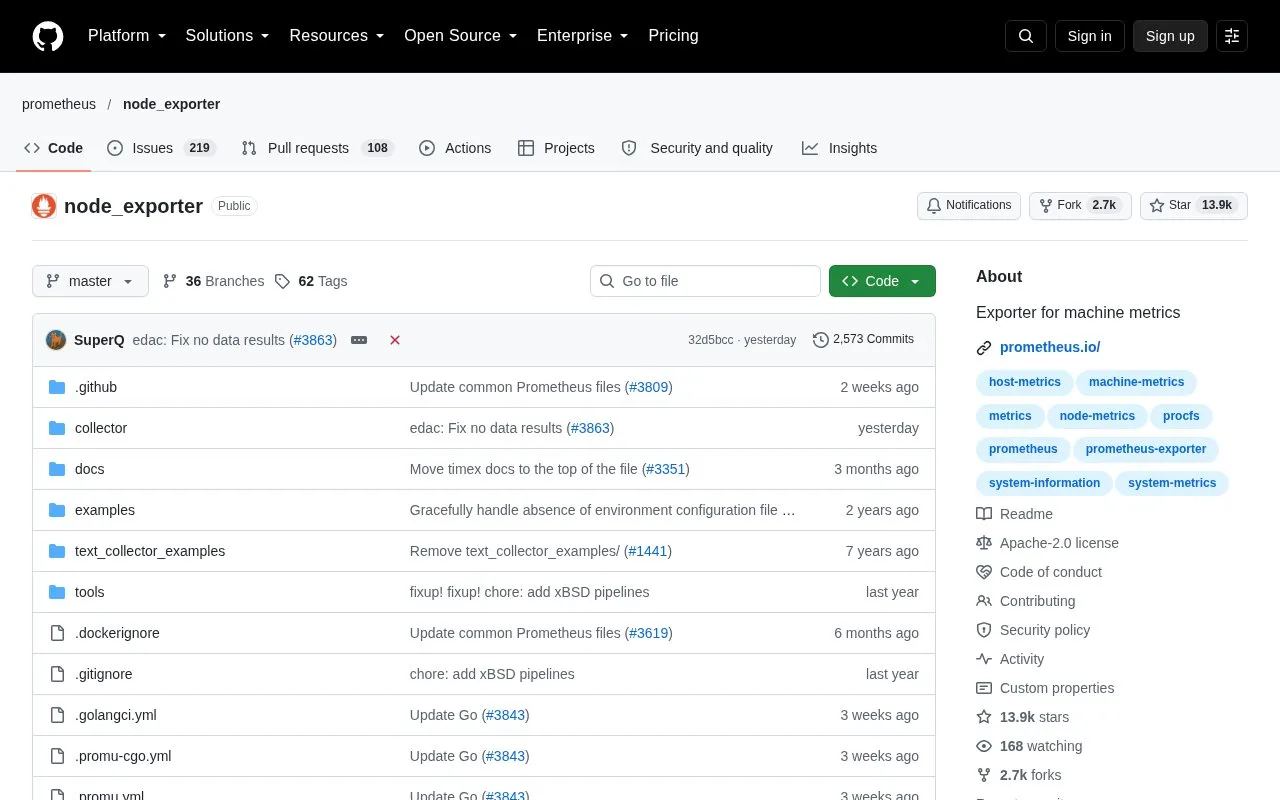
Prometheus Node Exporter is a host metrics collector for Unix-like systems. It reads hardware and kernel statistics through pluggable collectors and exposes the samples for Prometheus to scrape. The exporter does not retain time-series data or provide dashboards and alerting; teams pair it with a monitoring backend and choose collectors that match the host operating system.
Add host signals to a Prometheus job
The official guide starts with a release binary for the host operating system. Run Node Exporter on the machine to be monitored, then add its metrics endpoint as a target in a Prometheus scrape configuration. The default listener uses port 9100 and exposes metrics at /metrics. This gives an existing Prometheus server access to measurements such as CPU, memory, filesystems, and other hardware or kernel signals supported by the enabled collectors. These are documented steps, not a test performed for this listing.
Select collectors for the machine
Node Exporter uses pluggable collectors, and the available measurements vary by operating system and collector configuration. Review the collector list before assuming that a Linux dashboard or alert will work unchanged on a different Unix platform. Node Exporter targets Unix-like kernels; the Prometheus community maintains the separate Windows Exporter for Windows hosts.
The exporter is one component of a monitoring stack. Prometheus or another compatible scraper must collect the endpoint, and a separate query, storage, dashboard, or alerting service is needed for ongoing operations. The project is Apache-2.0 licensed and can be run on infrastructure the team manages.
Strengths
- Publishes hardware and kernel metrics that a Prometheus server can scrape from each Unix-like host.
- Pluggable collectors let operators select the host measurements exposed by the process.
- The project is distributed under the Apache License 2.0.
Watch out for
- Node Exporter targets Unix-like kernels; Windows hosts require a different exporter.
- It only exposes metrics. Time-series retention, querying, dashboards, and alert notifications require other components.
Best for
- Platform engineers adding Linux host health and hardware signals to a Prometheus deployment.
- Teams that need a lightweight host metrics endpoint and already operate a Prometheus-compatible scraper and backend.
Sources
- Monitoring Linux host metrics with the Node Exporter | Prometheus (Oct 26, 2026)
- prometheus/node_exporter (Oct 26, 2026)
- LICENSE (Oct 26, 2026)