
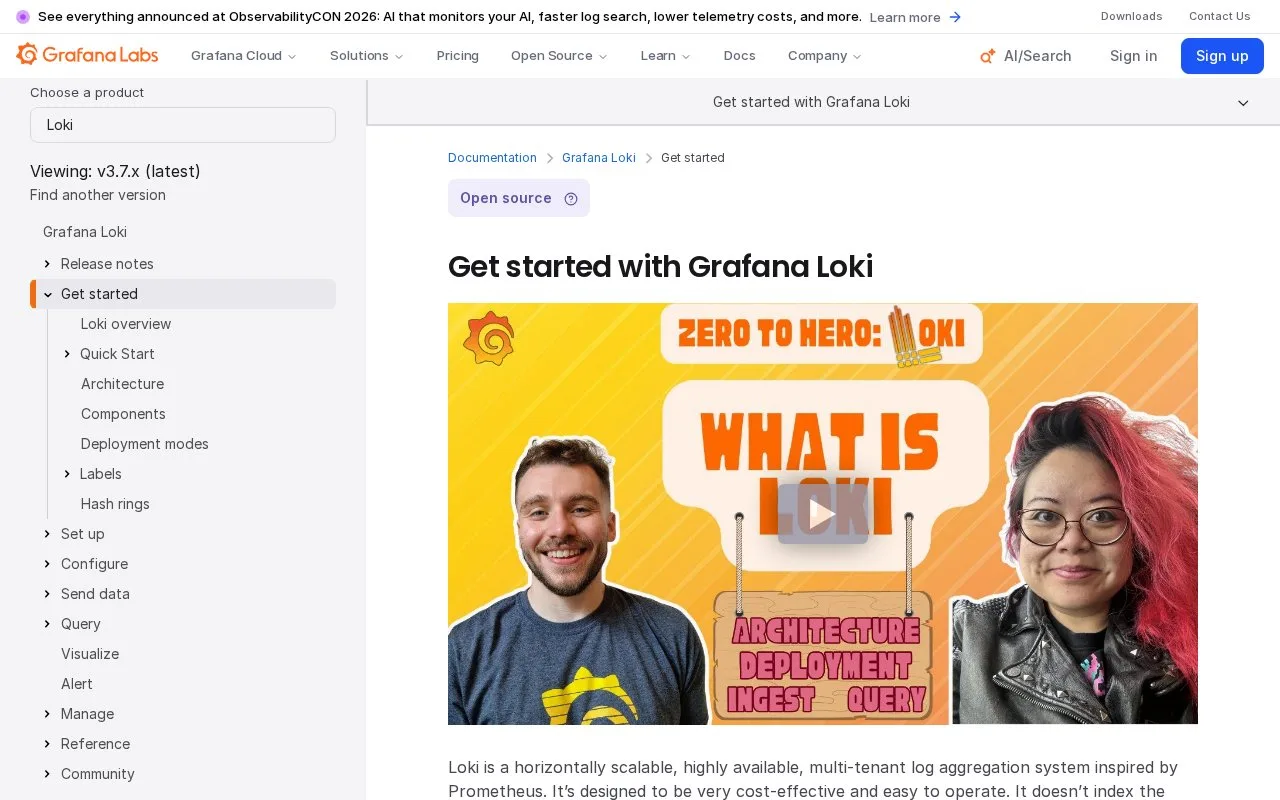
What it does
Loki is Grafana’s horizontally scalable log aggregation system. It indexes labels attached to log streams rather than building a full-text index over every log line, which changes how users should structure labels and queries. Its local quickstart uses Docker Compose and a sample application to show a small end-to-end log collection workflow.
For a first run, install Docker and Docker Compose, then follow the local quickstart’s Compose setup. The sample environment starts Loki together with a log-producing application so you can see ingestion and querying without wiring a production cluster. As you adapt the example, use a small set of labels that identify a stream, and avoid turning every high-cardinality value into a label.
Loki is a storage and query component for logs, not an alerting or application-diagnosis system by itself. It is most useful when paired with an interface and the rest of the team’s telemetry workflow. Grafana’s official repository license is AGPL-3.0; managed Grafana services and their usage limits are separate from the self-managed project.
Strengths
- The local quickstart uses Docker Compose and a sample log-producing application.
- Loki indexes stream labels rather than the full text of each log line.
- The official repository uses AGPL-3.0.
Watch out for
- A local evaluation needs Docker and Docker Compose.
- High-cardinality labels can make the label-based storage model a poor fit for uncontrolled fields.
Best for
- Collecting and querying application logs with a self-managed stack
- Adding a log backend to a Grafana-centered observability environment
Sources
- Get started with Grafana Loki | Grafana Loki documentation (Oct 25, 2026)
- Quickstart to run Loki locally | Grafana Loki documentation (Oct 25, 2026)
- loki/LICENSE at main | GitHub (Oct 25, 2026)