
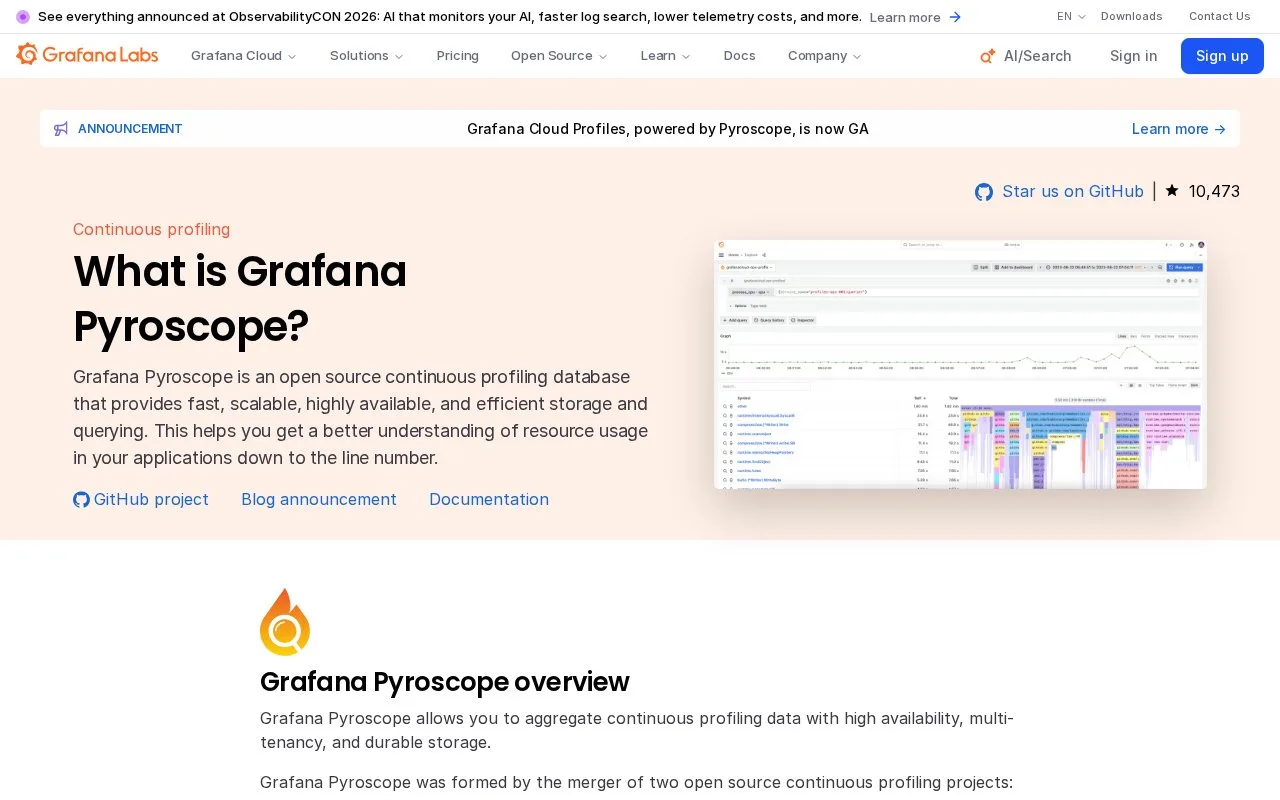
What it does
Grafana Pyroscope is an open-source continuous-profiling database. It ingests profiles from application SDKs, pprof endpoints, Grafana Alloy, or compatible OpenTelemetry sources, then stores and serves them for analysis. Engineers can use profiles to investigate where CPU or memory is being spent and correlate that view with metrics, logs, and traces in Grafana. It is useful when aggregate metrics show a performance change but do not identify which code paths consume resources.
Add profiles to the observability picture
Choose a supported client or instrumentation path for one service, then send its profiles to a Pyroscope server. The current SDK guide lists integrations for Go, Java, Python, Ruby, Node.js, .NET, Rust, and eBPF. The backend can start as a single process and later scale across machines; the documentation also describes object-storage options for keeping profile history.
An illustrative investigation: if a release raises CPU use, compare profiles from the affected service and use the line-level profile view to find code consuming the sampled time. Correlating that profile with metrics, logs, or traces in Grafana can help place the hotspot in a broader incident timeline. Profiles complement traces and metrics; they are not a substitute for application instrumentation or a full request-by-request event log.
Grafana Pyroscope's repository uses the GNU Affero General Public License, version 3. Teams should review that license for their deployment model. The repository and docs describe a server that operators run and maintain, rather than a hosted account included with the open-source database.
Strengths
- Aggregates continuous profiles and supports querying historical performance data.
- Offers client SDKs and eBPF collection paths across several common languages.
- Integrates profiling with Grafana's metrics, logs, and traces for cross-signal investigation.
Watch out for
- A profiler, SDK, or compatible source must be configured to send profiles before the database has useful data.
- The open-source server is licensed under AGPLv3, which may affect deployment and distribution choices.
Best for
- Finding CPU or memory hotspots in services that already emit profiles.
- Adding continuous profiling to a Grafana-centered observability setup.
Sources
- Grafana Pyroscope OSS | Open source continuous profiling database (Oct 25, 2026)
- Introduction | Grafana Pyroscope documentation (Oct 25, 2026)
- Pyroscope language SDKs | Grafana Pyroscope documentation (Oct 25, 2026)
- grafana/pyroscope (Oct 25, 2026)
- GNU Affero General Public License Version 3 (Oct 25, 2026)