
What it does
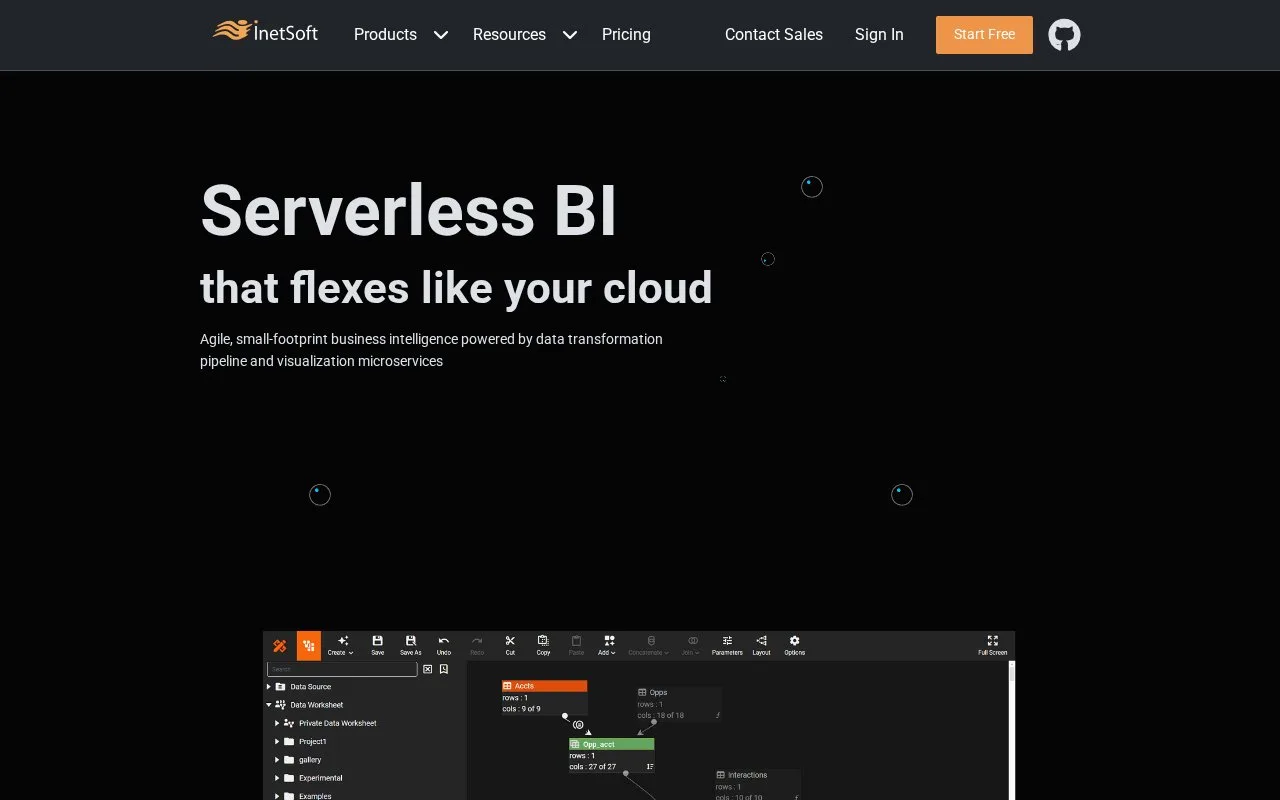
InetSoft's StyleBI combines visual data-transformation pipelines with dashboards, analytical exploration and paginated reporting. Access includes a free self-hosted core and individual cloud entry, plus commercial cloud and Enterprise options.
StyleBI combines visual data preparation, dashboards and paginated reports. A team can run the community core itself or buy a hosted or Enterprise arrangement.
| Access route | Operating and charging model |
|---|---|
| Free core | Self-hosted software; individual cloud entry is also available |
| Cloud App | Shared session-hour capacity for an organization |
| Cloud Dedicated | Dedicated hosting charged by virtual-core usage |
| Enterprise Self-Hosted | Commercial core-based or alternative licensing |
The self-hosted repository uses AGPL-3.0. Its Docker setup requires an administrator password before startup, followed by a local administrator login. This is separate from the hosted service's account and capacity arrangement.
Reports and their supporting assets can be moved together. In Enterprise Manager > Settings > Content > Repository, select assets and choose Export. Enter a ZIP filename and choose which dependencies to include before exporting. This keeps a report's required objects with the handoff instead of transferring only its visible layout.
Where reports use cached data, the cache's refresh schedule also determines which source changes appear in the output.
Strengths
- Combines visible data-transformation pipelines with dashboard and paginated output.
- Offers free core access alongside several commercial deployment models.
Watch out for
- Self-hosting requires operating a Docker-based environment.
- Cached analytical data needs its own refresh schedule.
Best for
- Teams combining visual data preparation with dashboards and paginated reports
Sources
- StyleBI free core and commercial deployment models (Oct 27, 2026)
- StyleBI Docker deployment and administrator account (Oct 27, 2026)
- StyleBI GNU AGPL version 3 licence (Oct 27, 2026)
- StyleBI asset export and dependencies (Oct 27, 2026)
- Business Intelligence Dashboard Reporting Software | InetSoft (Oct 25, 2026)