
What it does
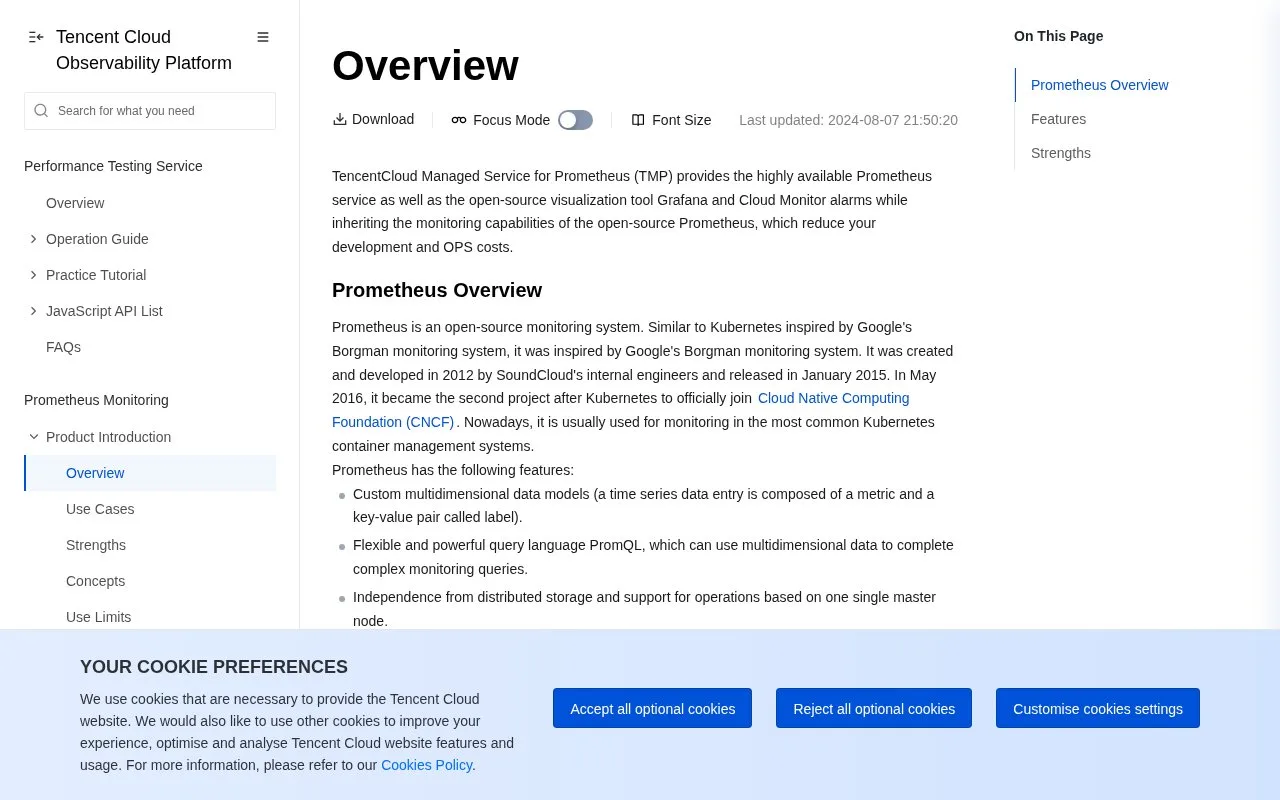
TencentCloud Managed Service for Prometheus (TMP) provides a hosted Prometheus-compatible service with managed instances, collection integrations, Grafana visualization, and Tencent Cloud alerting. It is designed to reduce the work of installing and operating a Prometheus server while retaining familiar Prometheus metrics and integrations. The documented Kubernetes path connects a TMP instance to a Tencent Kubernetes Engine cluster, lets operators configure collection, and exposes preset dashboards in Grafana.
A managed path for a TKE cluster
A documented first workflow is to create a TMP instance, choose its region and data-retention setting, associate a Grafana instance, and connect a Tencent Kubernetes Engine cluster. The operator can then choose collection integrations or adjust the metric rules and inspect the provided dashboards in Grafana. Alert policies can use templates in the Tencent Cloud Observability Platform. This is one documented path, not a requirement that every TMP use case run on TKE.
Illustrative example, not hands-on tested or configured: a platform team could connect a test Kubernetes cluster, keep only the metrics it needs, inspect CPU and workload panels, and create an alert for a sustained threshold. Prometheus-compatible data and alerting help detect a regression; the team still needs logs, traces, or a workload investigation to explain its cause.
TMP is billed pay-as-you-go, with usage tied to reported metric volume and retention. The service also offers a 15-day trial; the documentation says it is limited to 2 million series and 100,000 data points per second, and that it converts to pay-as-you-go by default unless the operator disables that behavior. Some configurations can also use separately billed resources such as a TKE Serverless cluster or Managed Grafana. Check those dependencies before estimating a total.
The product has a dedicated API documentation section. A console login and a purchased instance are required for the documented TKE setup. No account, cluster, trial, or monitoring data was created for this listing.
Strengths
- Provides a highly available managed Prometheus service rather than requiring the team to operate its own Prometheus server.
- Integrates with TKE collection, preset Grafana dashboards, and Tencent Cloud alerting templates.
- Maintains a dedicated API reference for managing the service programmatically.
Watch out for
- Costs vary with reported metrics, retention, collectors, and supporting cloud resources; the billing documentation describes separate resource charges as well as TMP usage.
- The 15-day trial has documented series and ingestion limits and converts to pay-as-you-go by default unless that setting is changed.
Best for
- Teams monitoring Tencent Kubernetes Engine or other supported workloads with Prometheus-compatible metrics.
- Operators who want hosted Prometheus collection and Grafana dashboards without running the metrics backend themselves.
Sources
- Overview - Tencent Cloud Observability Platform (Oct 26, 2026)
- TKE Monitoring - Tencent Cloud Observability Platform (Oct 26, 2026)
- Billing Overview - Tencent Cloud Observability Platform (Oct 26, 2026)
- Free Trial Introduction - Tencent Cloud Observability Platform (Oct 26, 2026)
- TencentCloud Managed Service for Prometheus APIs (Oct 26, 2026)
- Resource Usage and Billing Overview - Tencent Cloud Observability Platform (Oct 26, 2026)