What it does
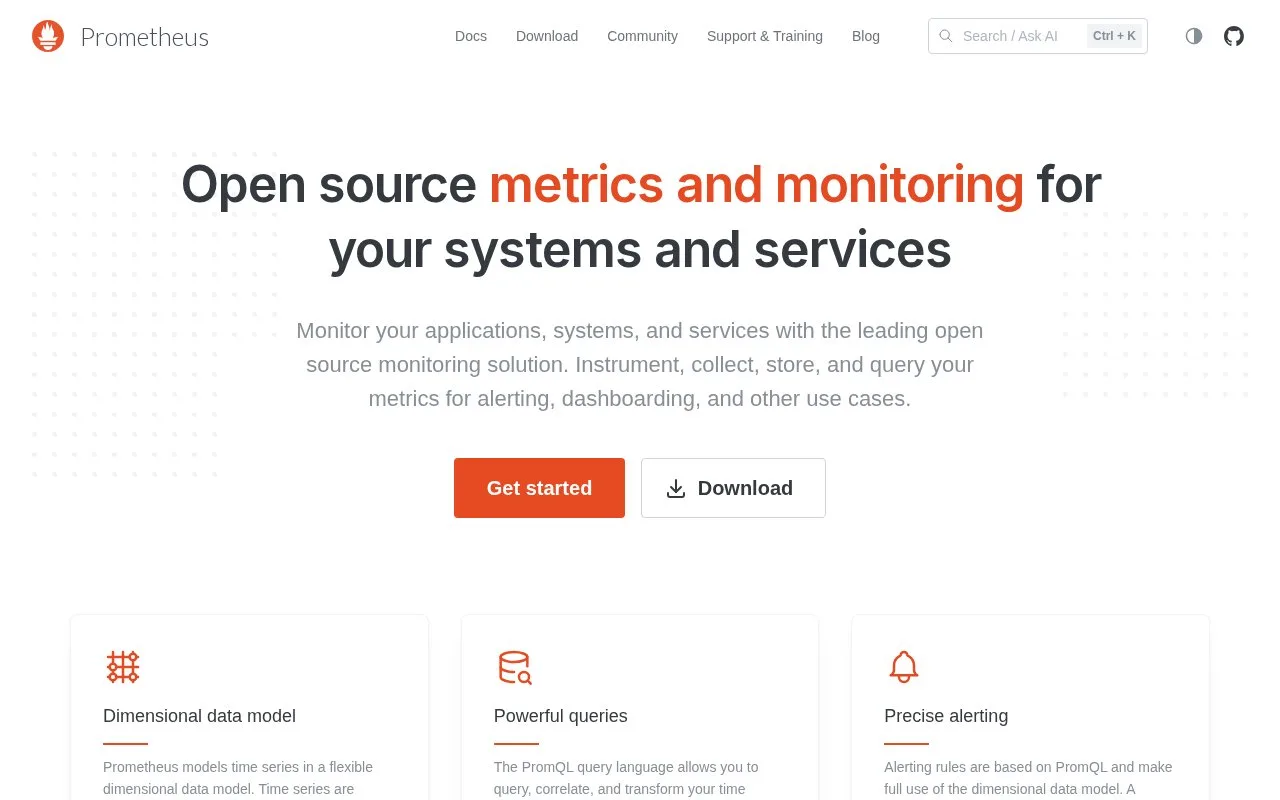
Prometheus is a monitoring system that stores time-series metrics and scrapes configured targets. Applications or exporters expose measurements on HTTP endpoints; Prometheus collects them and lets operators query trends or define alerting rules. It is self-hosted software, so the user manages its configuration and storage rather than signing up for a managed dashboard service.
The first-steps guide recommends downloading the Prometheus server for the target platform, extracting it, and starting the single server binary with a configuration file. The server then scrapes metrics from configured targets. To monitor an application, expose an HTTP metrics endpoint or use an exporter, add the target to the configuration, and query the resulting series. Prometheus is most useful once the application exposes metrics that answer operational questions such as request volume or latency.
PromQL can help investigate changes across time, and alerting rules can notify another component when a condition persists. The tool detects patterns in collected metrics; it does not repair a broken service or automatically explain every application error. Prometheus is Apache-licensed and is commonly operated as part of a wider observability stack.
Strengths
- The documented collection model scrapes metrics from HTTP endpoints.
- The distribution includes a single server binary and a configurable target list.
- PromQL queries and alerting rules are part of the monitoring workflow.
Watch out for
- Operators must expose or export useful metrics and maintain the Prometheus server and its storage.
Best for
- Collecting time-series metrics from instrumented services and exporters
- Investigating a service trend with queries or alert rules
Sources
- First steps with Prometheus (Oct 25, 2026)
- Prometheus (Oct 25, 2026)
- Apache License, Version 2.0 (Oct 25, 2026)
- Alertmanager | Prometheus (Oct 25, 2026)