
What it does
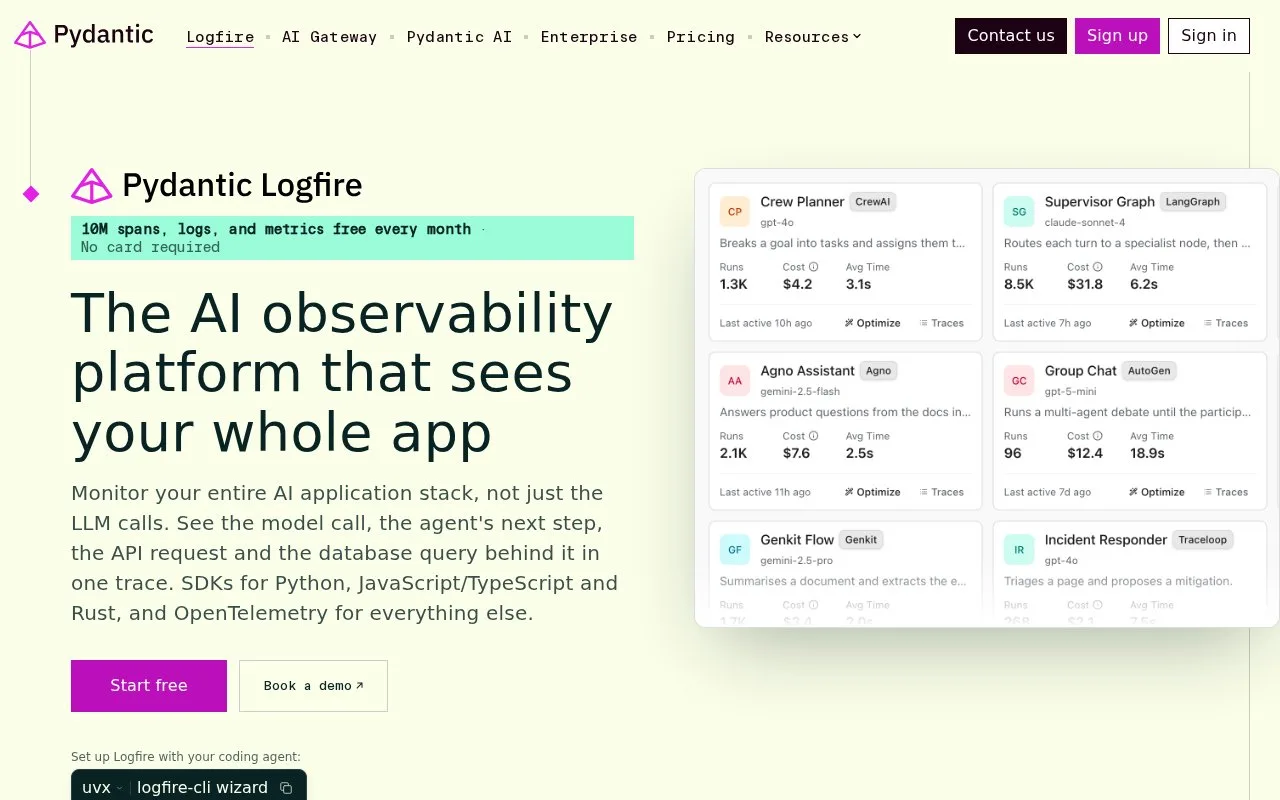
Pydantic Logfire is a hosted observability platform for applications, services, hosts, and AI systems. It uses OpenTelemetry-compatible traces, logs, and metrics to connect work across an application, including framework requests, database calls, and model interactions. Python developers can use Logfire's SDK and integrations, while its documentation also covers other languages and OpenTelemetry clients. The web interface lets teams inspect request traces and live telemetry rather than relying on isolated log lines.
Instrument one request before widening collection
For a FastAPI service, Logfire's guide starts by installing the FastAPI extra, creating or selecting a Logfire project, calling logfire.configure(), and then logfire.instrument_fastapi(app). After the endpoint receives a request, open the project's Live view and inspect the request span, its duration, arguments, and response status. The documentation stresses configuring the connection before instrumentation and instrumenting the same app only once.
From there, add integrations for the database and HTTP clients that matter to the request path. Nested spans help show whether time was spent in application code or a downstream call; manual logfire.span() blocks can add context around important work. The same trace-oriented approach is useful for LLM calls and agent workflows, where spans can preserve the sequence of model and tool operations.
The Personal tier includes a monthly telemetry allowance and pauses ingestion at its limit rather than charging overage. Paid plans meter additional records. Plan details and retention vary, so check the current pricing page before routing high-volume telemetry. Also review data scrubbing before enabling request instrumentation: the FastAPI documentation warns that endpoint arguments and URL parameters may contain personal data and can be stored as span attributes.
Strengths
- Correlates framework requests, database or HTTP work, logs, and AI activity as trace data instead of isolated events.
- Provides an OpenTelemetry-compatible workflow with Python convenience instrumentation and documented clients for other languages.
- The pricing page gives a free monthly record allowance and pauses ingestion at the Personal plan limit.
Watch out for
- FastAPI route arguments and query parameters can be captured as span attributes, so teams should configure scrubbing before transmitting sensitive values.
- The Personal plan stops ingesting once its monthly record cap is reached, which can interrupt telemetry if volume is not watched.
Best for
- Python teams following a request from a FastAPI route into database, HTTP, or model calls
- AI engineers tracing agent steps and evaluating changes against captured telemetry
- Teams that want OpenTelemetry instrumentation across services with a Python-first setup
Sources
- Pydantic Logfire: AI Observability for LLMs, Apps & RAG (Oct 26, 2026)
- Getting started with Pydantic Logfire (Oct 26, 2026)
- Instrument FastAPI: see every request your app handles (Oct 26, 2026)
- Logfire Onboarding: Adding Manual Tracing (Oct 26, 2026)
- Pricing and Plans for Pydantic Logfire (Oct 26, 2026)