
What it does
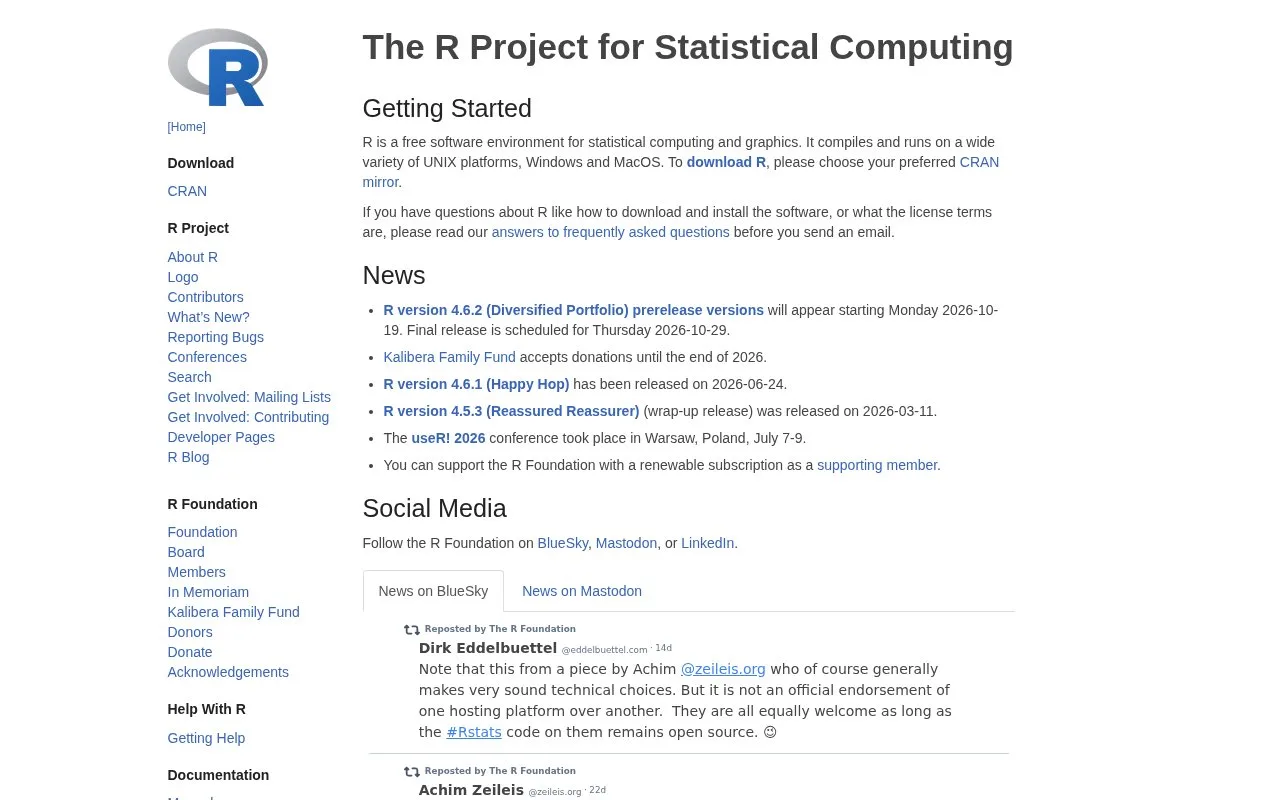
R is a language and software environment for statistical computing and graphics. Its interactive console works with vectors, matrices, and data frames, while packages add methods for specialized analysis and visualization. The official introduction begins with vector assignment and summary functions; the installation manual explains platform-specific setup. The core project is free software, while package licenses can differ.
Try the vector workflow in the official introduction
After installing R for your operating system, start the interpreter and follow the manual's example: assign five measurements to a vector with x <- c(10.4, 5.6, 3.1, 6.4, 21.7), then inspect mean(x) or var(x). The same guide leads from vectors into data frames and graphics, so a reader can extend a short calculation into an exploratory analysis. The R installation and administration manual covers obtaining source or binaries, installing the software, and configuring an installation. The project is useful for statistical exploration and reproducible analysis, but a user still chooses packages and an execution environment that fit the work. R's source tree includes a GPL version 2 license; third-party packages may have different terms, so check their own license files before redistributing a project.
Strengths
- The official introduction moves from vectors and summary functions into statistical models and graphics.
- An interactive language environment supports exploratory analysis and reusable scripts.
- The official source tree and installation manual are maintained alongside the language documentation.
Watch out for
- The core R environment does not include every analysis package; users choose and manage additional packages for their tasks.
- Package license terms can differ from the GPL license in the core source tree.
Best for
- Analysts and developers exploring data with statistical summaries and graphics.
- Teams building reproducible analysis scripts around R and its package ecosystem.
- Learners who want an official language introduction with runnable vector and plotting examples.
Sources
- R: The R Project for Statistical Computing (Oct 25, 2026)
- An Introduction to R (Oct 25, 2026)
- R Installation and Administration (Oct 25, 2026)
- R source repository (Oct 25, 2026)
- R GNU General Public License version 2 (Oct 25, 2026)