
What it does
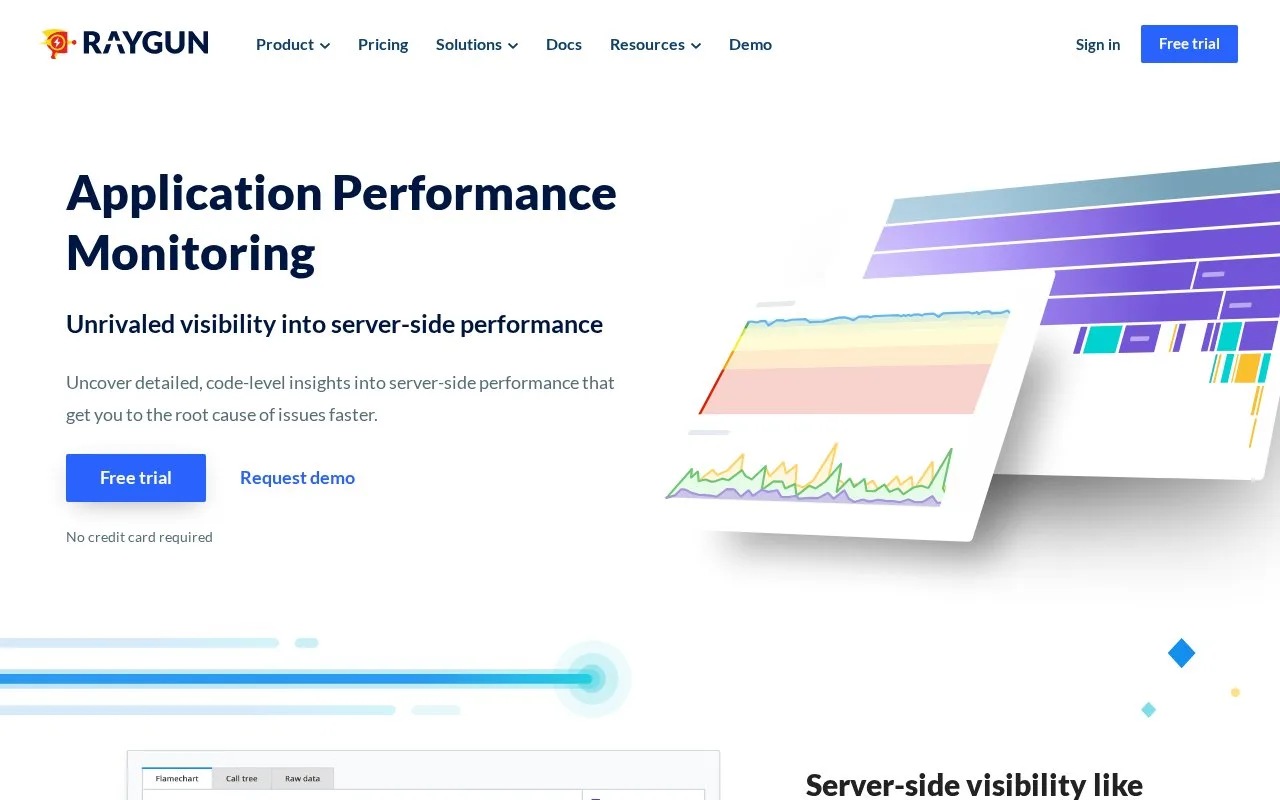
Raygun APM instruments supported applications to collect server-side performance traces. Its product guide describes request views segmented by methods, database queries, and external API calls, with profiling features for investigating slow paths. The broader Raygun platform also includes crash reporting and real-user monitoring; this listing focuses on its APM component and the application agent needed to collect traces.
Add the agent to one supported service
For a Node.js application, Raygun's APM guide installs the raygun-apm module, adds require('raygun-apm/http') near the start of the application, and reads the project key from RAYGUN_API_KEY. Once configured, traces can expose the work within a request, including method calls, queries, and external API calls. These are the documented steps, not an installation or live trace collected for this listing.
A useful first investigation is a slow route that calls a database and a third-party API. Compare the spans in its trace to see which section takes most of the time, then use the relevant source code or database diagnostics to investigate further. APM narrows the search; it does not fix the code or tell you whether every captured request is representative.
The product page lists support for .NET, Ruby, and Node.js and offers an APM trial. Raygun's pricing page presents monthly and annual billing choices, with usage-based limits that depend on product and volume. Confirm the APM allowance and trial terms for the selected plan before instrumenting production.
Strengths
- Traces break server-side requests into methods, queries, and external calls for code-level diagnosis.
- The Node.js guide documents an agent installation and API-key configuration path.
- The platform can complement crash reporting and real-user monitoring in the Raygun suite.
Watch out for
- Useful traces require installing and configuring an agent for a supported application stack.
- Trace data helps locate a slow component but does not itself repair code or establish root cause without further investigation.
Best for
- Node.js, Ruby, or .NET teams investigating slow server-side requests.
- Developers who need to compare method, query, and external-call timing within a request.
- Teams already using Raygun crash reporting or real-user monitoring that want server-side performance traces.
Sources
- Raygun Application Performance Monitoring (Oct 25, 2026)
- Raygun Documentation (Oct 25, 2026)
- Application Performance Monitoring for Node.js (Oct 25, 2026)
- Raygun Pricing (Oct 25, 2026)