
What it does
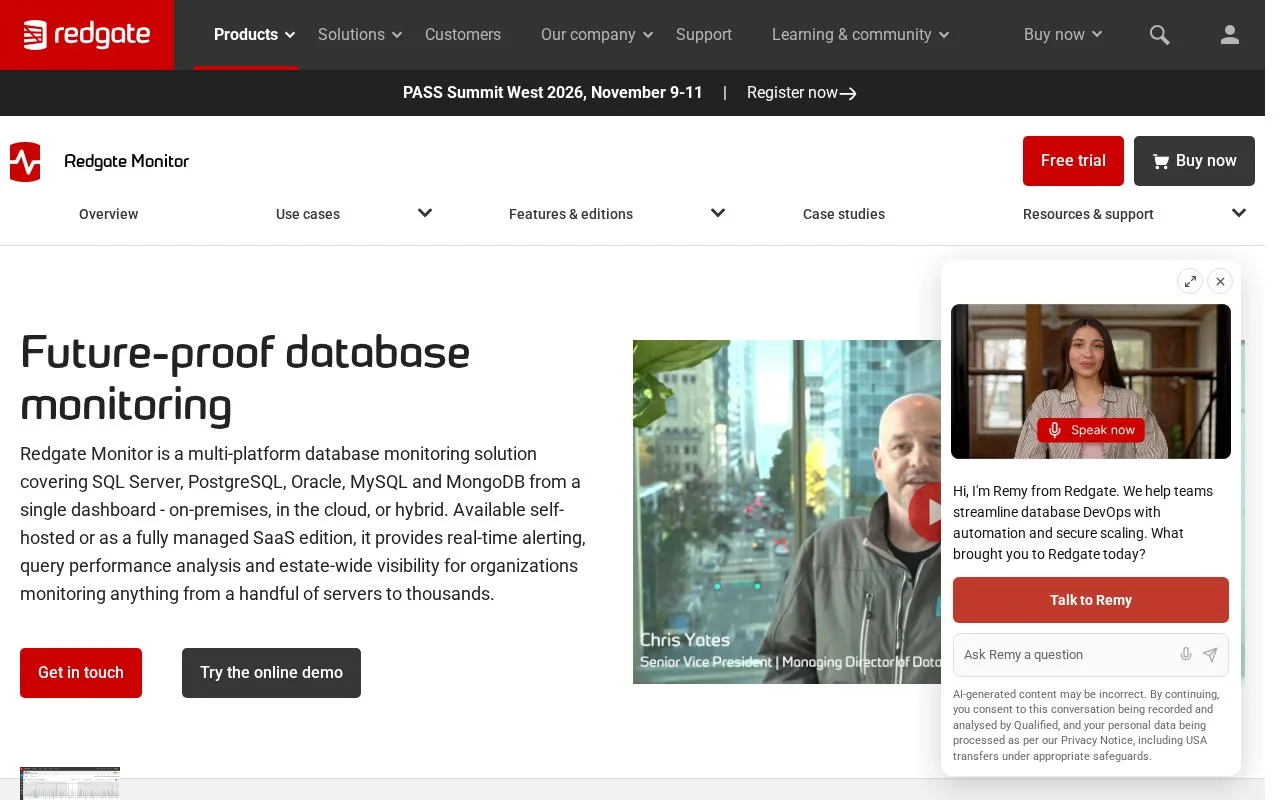
Redgate Monitor is a multi-platform database monitoring tool with a web-based estate view, alerting, query analysis, deployment tracking, and diagnostics. Redgate lists support for SQL Server, PostgreSQL, Oracle, MySQL, and MongoDB, with self-hosted and SaaS editions. It is intended to help database teams discover and investigate performance or availability problems; it does not automatically determine whether a query, deployment, or infrastructure change is the correct fix.
Redgate Monitor is useful when a DBA has to look across a mixed estate rather than open a different dashboard for each database family. The documentation describes a setup path that begins with installing the product, adding monitored servers, and configuring alerts. Once data arrives, teams can use the global overview to spot servers needing attention, then drill into performance metrics, query impact, activity, or deployment history.
For example, after a release that slows a PostgreSQL or SQL Server workload, an operator can compare the affected server's metrics with deployment events and query activity. That helps narrow the investigation, but the team must still verify whether the cause is the release, blocking, resource pressure, or another change. Monitoring is evidence for diagnosis, not an automatic rollback policy.
The product page lists Standard pricing by server and annual term, while Enterprise is presented as a sales conversation. It also offers a 14-day trial. The page's displayed dollar figure does not label a currency explicitly in the content reviewed, so this record avoids repeating an exact price. The Enterprise Data API is an edition-specific feature, not a guarantee that every license includes it.
Strengths
- Presents SQL Server, PostgreSQL, Oracle, MySQL, and MongoDB in a shared monitoring view.
- Combines alerts with query analysis, deployment tracking, and historical performance diagnosis.
- Offers self-hosted and SaaS editions.
Watch out for
- The Data API is listed as an Enterprise feature, and the two editions do not have identical capabilities.
- The exact displayed dollar price was omitted because its currency and regional applicability were not explicit in the accessed page text.
Best for
- DBA teams that monitor multiple database engines across on-premises and cloud hosts
- Investigating a performance regression alongside query, alert, and deployment history