
What it does
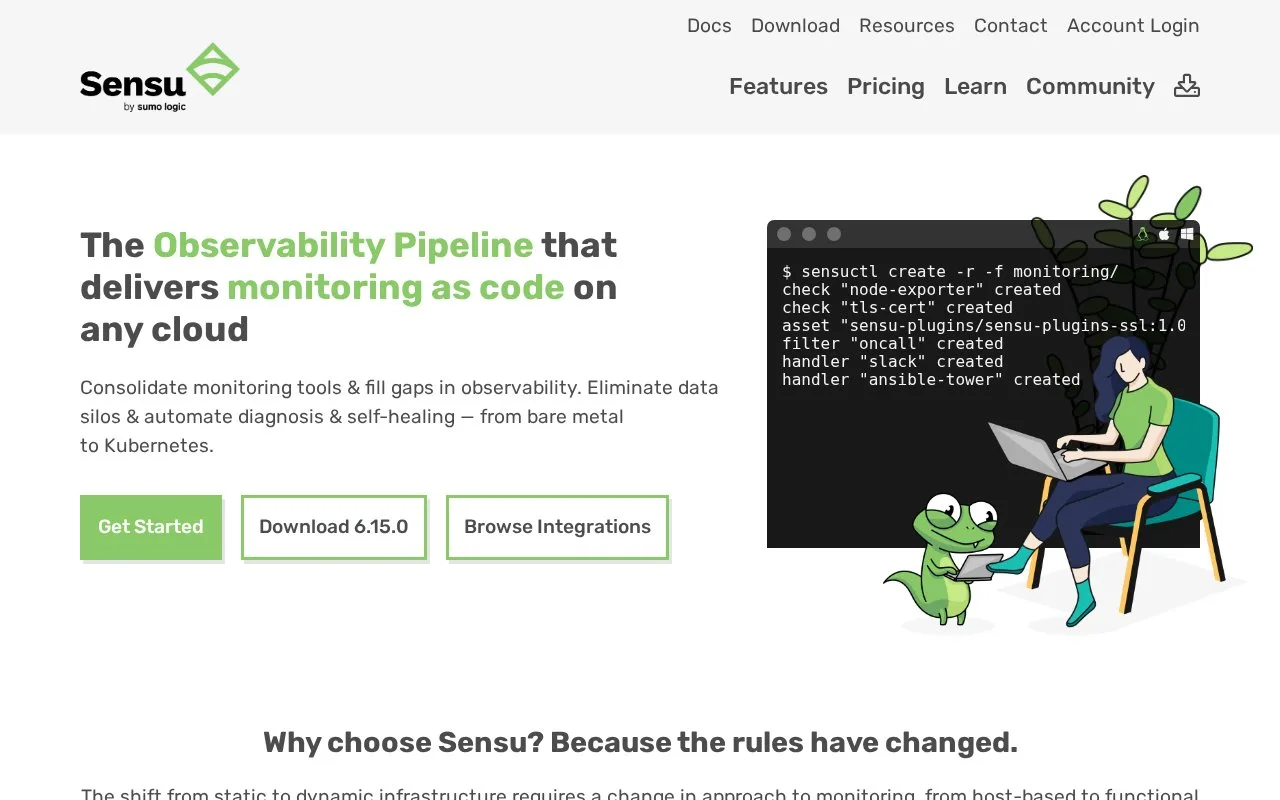
Sensu Go is software for collecting checks and metrics from servers, containers, applications, and other infrastructure, then processing and routing the resulting events. Teams can express monitoring configuration as code, group checks with entity subscriptions, and connect the pipeline to existing tools such as Prometheus, InfluxDB, PagerDuty, or Ansible. It is self-managed: agents run on monitored infrastructure and a Sensu backend coordinates the workflow, with a web interface and command-line/API controls for operators.
Build a monitoring pipeline, not another silo
Sensu Go uses agents to report checks and observation data to a backend. The backend can filter, transform, and route events, while subscriptions let teams assign checks by an entity's role instead of hand-mapping each check to each host. That model is useful when infrastructure is short-lived: agents can register and deregister as machines or workloads appear and disappear. Sensu also accepts common monitoring formats and can complement tools already collecting metrics or logs rather than forcing a full replacement.
A practical first setup
The official quick start walks through installing a backend, installing the sensuctl command-line tool, and configuring a first monitor. Sensu's homepage also documents a Docker-based local backend and agent example. After the backend is reachable, define a check and its subscription, then choose a handler or integration for the event. For example, a team could apply one service-health check to every entity subscribed to a web role and route failures to its incident channel.
The web UI gives operators a view of entities, checks, and events; sensuctl and the documented API support configuration and automation. The Sensu Catalog and asset hub provide integrations, and plugins can be written in different languages. This makes the system adaptable, but it also means administrators own the backend, agents, configuration, and integration choices.
Licensing and scale
The pricing page lists a free tier capped at 100 nodes and paid Pro and Enterprise tiers billed per node annually. Paid tiers raise the node limits and include commercial support; a 14-day trial is offered for evaluating beyond the free tier. Sensu describes the product as commercial software built on an MIT-licensed open-source core, so the open-source core should not be confused with every commercial feature or support entitlement.
Strengths
- Subscriptions let operators apply checks by entity role, which fits changing or ephemeral infrastructure.
- The event pipeline accepts several common metrics formats and integrates with existing monitoring systems.
- Configuration can be managed through declarative files, `sensuctl`, and a documented API.
- An MIT-licensed core is available alongside paid commercial features and support.
Watch out for
- The backend and agents must be deployed and maintained by the team using the self-managed product.
- The free tier is capped at 100 nodes and does not include commercial support.
Best for
- Applying monitoring-as-code practices across cloud, container, and bare-metal environments
- Routing checks and metrics from existing systems through a configurable event pipeline
- Monitoring infrastructure whose entities are frequently created and removed
Sources
- Sensu | Observability Pipeline (Oct 25, 2026)
- Sensu Go - Sensu Docs (Oct 25, 2026)
- Sensu | Standalone Sensu Pricing (Oct 25, 2026)
- Sensu Go MIT License (Oct 25, 2026)