
What it does
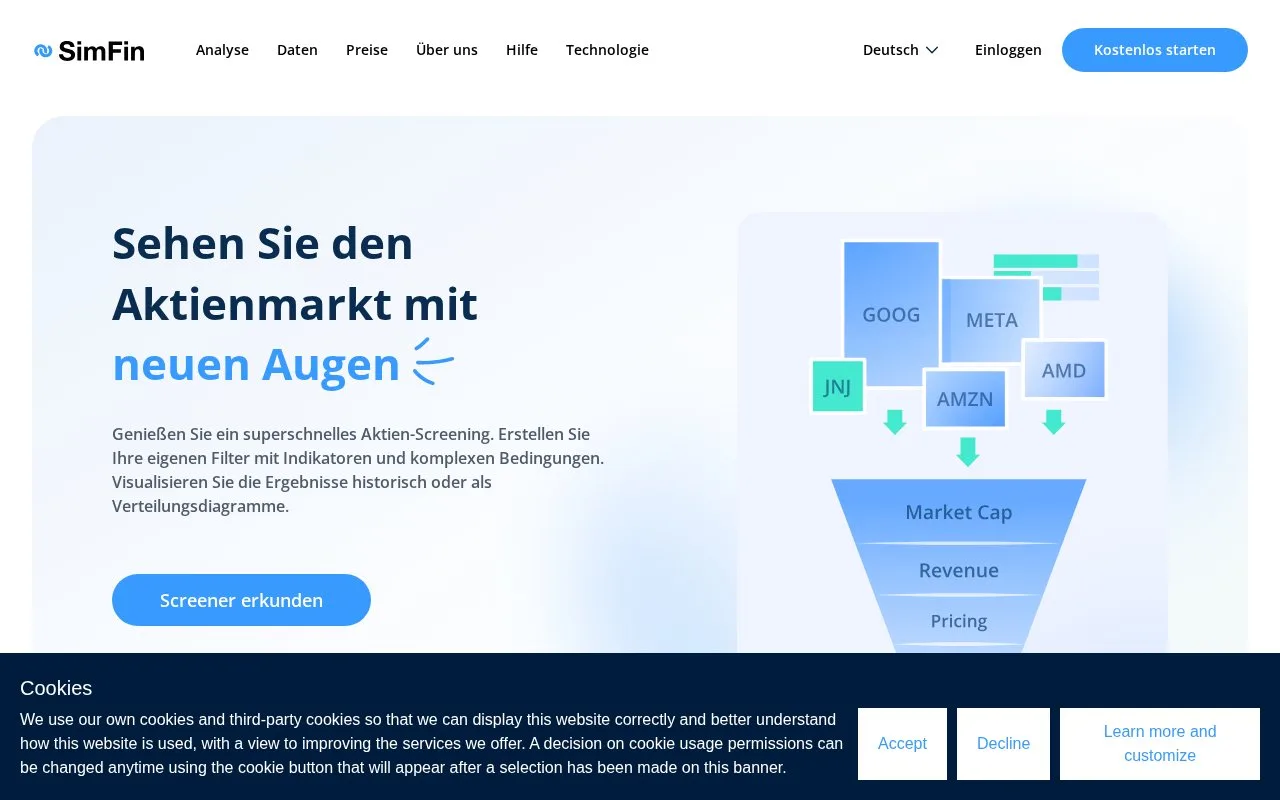
SimFin combines stock screening, fundamental charts and strategy backtesting with downloadable financial data. It lets users define custom filters, indicators and weighted scores. A free account covers five years of company history, while paid plans extend history and download features.
From a screen to a historical comparison
Choose Explore Screener to combine financial conditions, then examine the results in line, distribution or scatter plots. Backtesting can compare a set of rules with earlier periods. CSV downloads and the API let researchers move the same kind of data into their own models.
| Plan | Price with annual billing | History and notable features |
|---|---|---|
| Free | US$0 | Five years of chart and fundamental history, 5,000 US stocks and 500 high-speed backtesting credits |
| Start | US$15 a month | Ten years of history, Excel plugin and private portfolio saving |
| Basic | US$35 a month | 15 years of history and premium bulk datasets |
| Pro | US$71 a month | More than 20 years of history |
Use Start Free for an account before deciding whether longer history or a larger credit allowance is needed. Historical simulations remain sensitive to the rules and period selected.
Strengths
- Custom conditions can be examined through several chart types
- Offers API and CSV data access alongside browser analysis
Watch out for
- Saving private portfolios requires a paid plan
- The free history is limited to five years
Best for
- Fundamental investors creating their own screens
- Researchers downloading financial statements for modelling
Sources
- SimFin screening, charting and data access (Oct 27, 2026)
- SimFin stock analytics and API plans (Oct 27, 2026)