
What it does
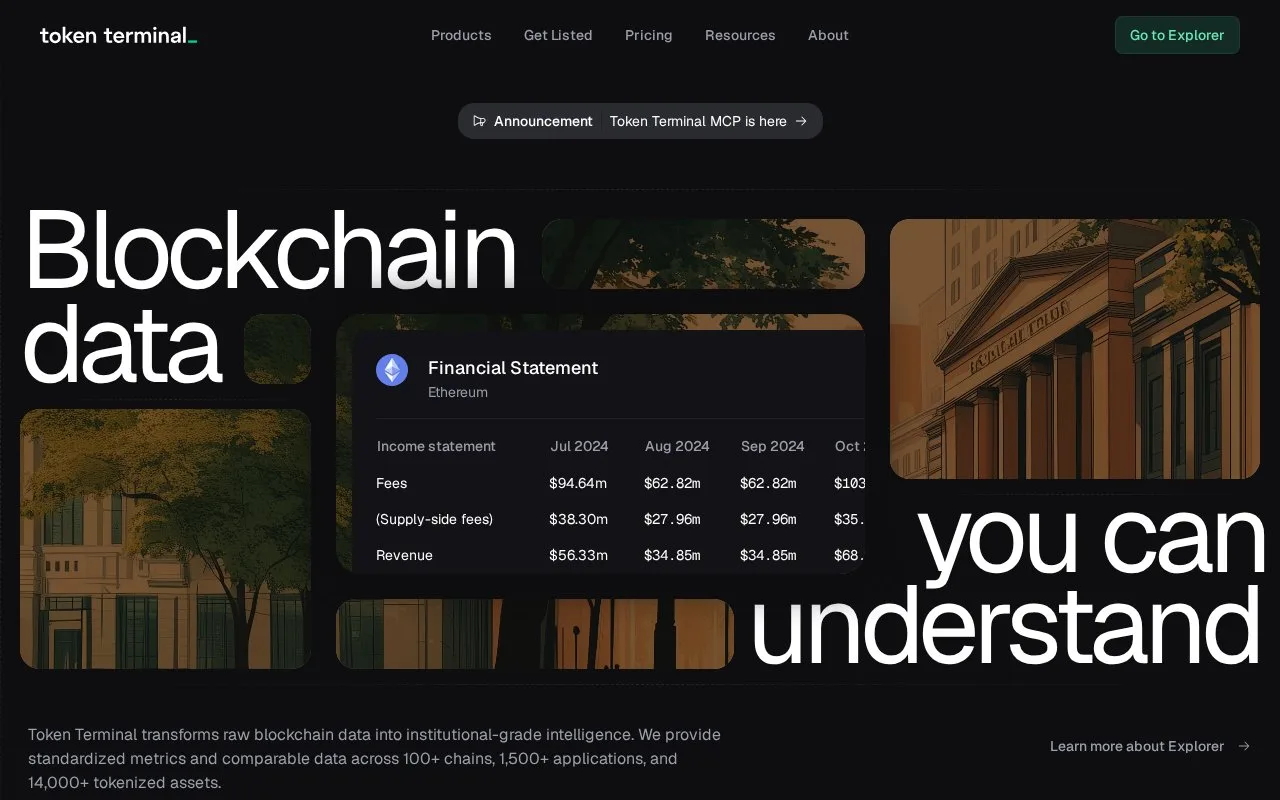
Token Terminal standardizes financial and usage data for blockchains and applications. Its free account includes historical core data and limited custom charts; Pro adds downloads, integrations and unlimited dashboards at a listed $350 per month.
Token Terminal separates total fees, the portion paid to suppliers and revenue retained by a protocol. Read both the general metric definition and its project-specific explanation before comparing two businesses. A chart with the same label can still differ from another provider’s chart because of methodology, supported chains or contract versions.
In Studio, choose a metric in the left panel, then filter by project, sector, deployment chain or product. Group by the dimension you want to compare, and set the chart type, period and granularity. Metric selection narrows the available filters; Active loans, for example, limits the choices to lending projects.
Time series shows each period separately, Cumulative adds periods together, and Percent share compares each group’s contribution. Add a title and a footnote explaining the comparison, save the chart, then use Share for a link. Clone opens a separate editable copy when an existing chart is a useful starting point.
An email-and-password account or Google login starts the Free plan. It includes three custom charts and three dashboards, but excludes CSV downloads, spreadsheet plugins and team access. Pro is $350 per month in the monthly pricing view, with a seven-day trial. The API connection for other programs and Datashare use custom quotes; the published API plan lists 250,000 daily requests.
A data export needs Pro or an API subscription. Standardized figures help compare activity and finances; they do not predict an asset’s future return.
Strengths
- Metric definitions include project-specific context
- Charts can distinguish products deployed on different chains
- A saved chart can be shared by link or copied as an image
Watch out for
- CSV and spreadsheet downloads require paid access
- Comparisons depend on the chains and contract versions included in each project
Best for
- Analysts comparing protocol fees and retained revenue
- Teams building repeatable financial dashboards for crypto projects
Sources
- Token Terminal standardized financial metrics and underlying blockchain data (Oct 27, 2026)
- Token Terminal monthly pricing and included versus excluded plan features (Oct 27, 2026)
- Token Terminal general and project-specific metric definitions (Oct 27, 2026)
- Token Terminal chart creation, grouping, saving and sharing (Oct 27, 2026)
- Token Terminal data-download access and methodology differences (Oct 27, 2026)
- Token Terminal email-password and Google account creation (Oct 27, 2026)